.png?width=274&height=200&scale=canvas)


.png?width=500?width=274&height=200&scale=canvas)

.png?width=274&height=200&scale=canvas)


Benchmarking games allows you to check the performance of your components and, of course, flex your gaming PC specs with your friends or the Reddit and YouTube community. This guide will show you how to set up benchmarking software and show your stats in an OSD (On-Screen Display) using MSI Afterburner and RivaTuner.
Why Benchmark Your Gaming PC?
Whenever you build a new gaming PC or buy a pre-built PC it’s a good idea to benchmark your virgin machine before you start installing too many applications and games. You will then have an original performance benchmark for your CPU, GPU and RAM including power usage and temperatures, which means you can see how your components are degrading over time and often understand where problems are arising in future.
Benchmarking is not just a way of flexing your gaming capabilities - it is in fact a great way to troubleshoot games or failing components in your system. For instance, New World recently had a major problem that meant it was bricking and overheating GPUs, as well as pulling huge amounts of power from PCs. The developers had left one of the settings as “unlimited” during the menu screens, which meant there was no cap on the amount of power it could draw. That one setting was allegedly responsible for exploding Michael "Shroud" Grzesiek's UPS (Uninterruptable Power Supply) during a stream, and millions of gamers questioning the sanity of Amazon Games’ development team. In fact, the fault lies with a small handful of GPU manufacturers and video card models.
"In the last few days, we have received few reports from players who have had problems with their GeForce RTX cards. After extensive investigation, we were unable to identify any unusual behavior on the part of New World that could be the cause of these problems. EVGA has already confirmed errors in the production of some GeForce RTX cards. New World can be played safely. For players who have encountered a hardware failure, we recommend that you contact the manufacturer." —Amazon, via hardwareluxx.de
The speed in which this bug was found can be attributed to the benchmarking software that gamers run during gameplay. Tools like MSI Afterburner and RivaTuner - the tools we’re going to be showing you today - display the power usage during gaming, which can help identify any problems before you are sat next to a potential fireball.
Performing a benchmark is great when you first get a PC, but you might also have owned your gaming rig for some time and only just got round to benchmarking. That’s fine too, and this guide will still be useful no matter how long you’ve owned your PC. There will be benchmarks out there for you to compare yours to, and see how you stack up against a “fresh” version of your system.
The Best Benchmarking Software
Most of the time, you will see two tools used on YouTube for benchmarking. MSI Afterburner and RivaTuner. Using both of these tools together allows you to display all the system temperatures, power usage, GPU framerates and other vital statistics on screen while you are playing via an OSD (On-Screen Display). This overlay will be shown during gameplay, and you will be able to see how your hardware performs in real time.
MSI Afterburner
MSI Afterburner is a very reliable graphics card monitoring application and happens to be the most popular tool in the world. It works with any video card – not just MSI branded – and allows you to have complete control, monitoring hardware in real-time. MSI Afterburner is 100% free and can be used with any brand of graphics card.
RivaTuner
Predominantly a tweaking application, RivaTuner allows you to tune your NVidia GPU based card and works with your graphics driver to monitor and diagnose an exhaustive set of variables. This is known as the hook. RivaTuner injects itself into the drivers using APIs such as DirectX.
RivaTuner comes with MSI Afterburner and you should not need to install it separately. Essentially, RivaTuner is the customised OSD aspect of the setup. Some games have anti-cheat mechanisms or specific code that will prevent you from using tools like RivaTuner, but there are workarounds that can be found with enough Googling and YouTube searching.
Setting Up Your Benchmarking Software
First things first, you will need to install MSI Afterburner from the MSI website, here. The direct link is https://www.msi.com/Landing/afterburner/graphics-cards
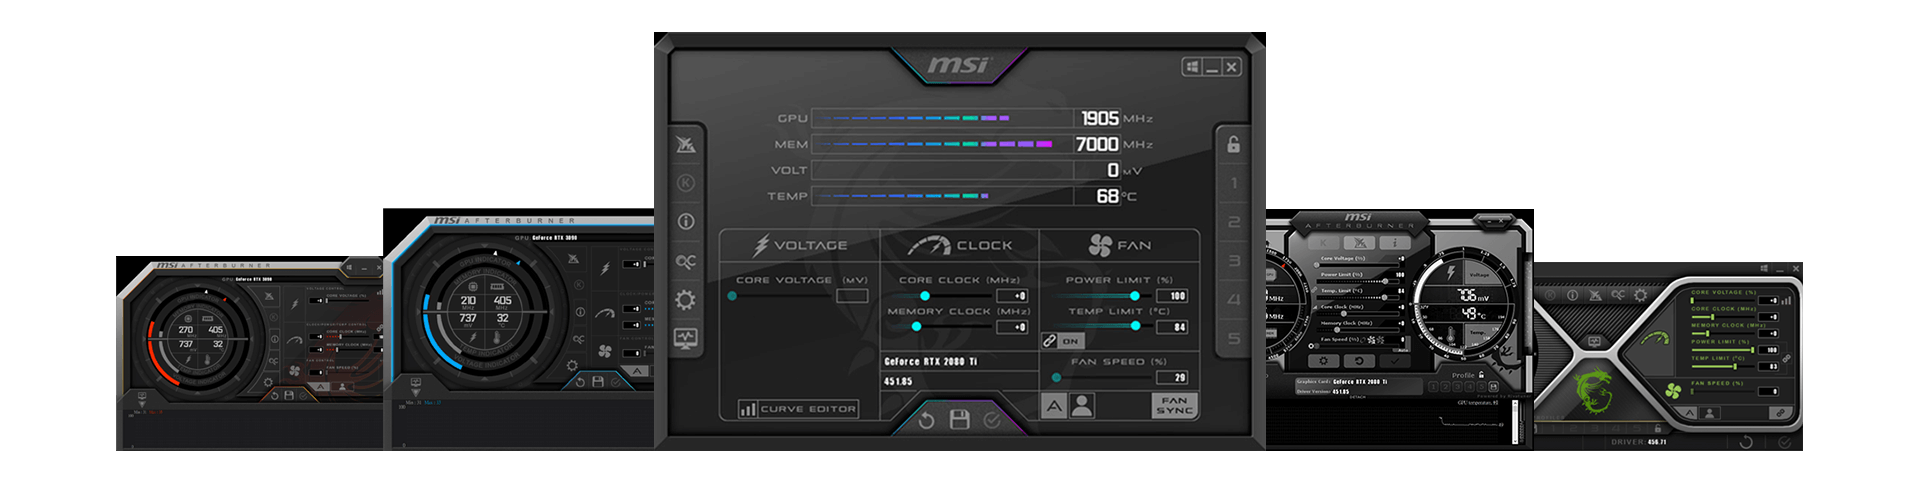
Download and install MSI Afterburner, and agree to the RivaTuner install also. Once both of these applications are installed, you will have the option to run MSI Afterburner. The default skin and dashboard will be shown: -

This is the first screen you will see, and you will be able to access all of your tweaking, tuning and OSD benchmarking settings from this dashboard.
On the left of the dashboard you will see the settings cog, and this is where we can access all of the monitoring and OSD properties. Click the settings cog to display the MSI Afterburner properties window: -

Selecting Benchmarking Properties For OSD
With the properties window open, click on the Monitoring tab: -
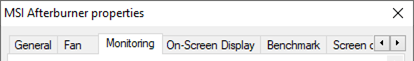
You will now see a long list of available properties, and the option to display in the OSD: -

You can check or uncheck the properties you want to monitor by clicking the check icon next to the property.
Below this list you will see the option to Show in On-Screen Display. You can toggle this by clicking the check box: -
You can go through this list of properties and begin checking and unchecking the actual temperatures and parameters you want to see in your OSD.
Most Popular Benchmarking Settings
- GPU Usage
- GPU Power Usage
- GPU Memory Usage
- GPU Temperature
- CPU Usage
- CPU Power Usage
- CPU Temperature
- Memory (RAM) Usage
- Framerate
You can add or remove these as you wish, but these are the most popular ones you’ll see.
Benchmarking OSD Settings
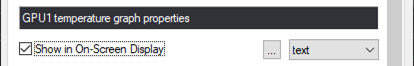
You can customise the OSD to your heart’s content and change the fonts and appearance of each OSD parameter.
You have the option to show the text or a graph (or both) representation of the parameters, also: -

You can also change the labels of the OSD under “Override Group Name”, so they are easier to understand: -

Once you have selected all of the parameters you wish to display, you can click Apply and OK to save your changes.
Next, we will configure the OSD. We can do this by selecting the On-Screen Display tab, and clicking the More button on the menu: -

You will then see a window that looks like this: -
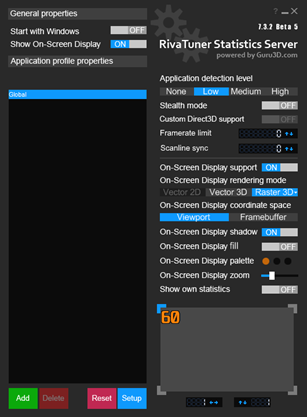
These settings affect the On-Screen Display globally, and you can increase the size or change positioning for the OSD here. The On-Screen Display Fill is particularly useful, as it makes the text much easier to read in-game.
It is helpful to play with these settings during gameplay so you get the right look and feel for your benchmarking stats.
Displaying The OSD
The easiest way to bring up the benchmarking OSD is to set a keyboard shortcut. Open the settings menu again and click on the On-Screen Display tab once more. Under Global On-Screen Display hotkeys click in the box where it says None.

Now hold down a keyboard shortcut you want to use to toggle the OSD. You could hold down ALT + F7 for example. Now, when the game is running, you simply hold down the shortcut and the OSD will display.

Project Cars Benchmarking Screenshot
As you can see from the example above with Project Cars, I have chosen to display a slightly larger font, and placed the OSD a little further down from the top of the screen.
TIP: OSD won’t display? Make sure you run MSI Afterburner and RivaTuner BEFORE you launch your game. This will enable the tools to hook into the game as it loads.
Recording Your Benchmarking
MSI Afterburner allows you to record direct from the application, or you could use OBS / Camtasia Recorder to record your screen.
The MSI Afterburner video capture settings can be found under the Video capture tab in the properties window: -

You can tweak the default settings and also add a hotkey (keyboard shortcut) to record your gameplay.
Benchmarking Games Recap
Now, it’s over to you. You can have a lot of fun with the basic setup we’ve described above, but there are a number of advanced settings such as overclocking that we haven’t had time to cover here. There are numerous videos on YouTube and forum posts that will help you take your benchmarking to the next level, so if you want to get the most out of your gaming PC and new benchmarking addiction, we recommend checking out these links…
-
New PC? What To Do Next (Reddit r/BuildAPC)
-
UserBenchmark Tool: Install UserBenchmark tool to ensure your PC is running as expected once you boot it for the first time. This will highlight any overclocking issues or potential underperforming components.
Enjoy!